MMA Project Book, Chapter 8, Section 3
PHOTONIC SYSTEMS
John Payne
Bill Shillue
Andrea Vaccari
Last modified 13 August 1999
Revision History
1998-11-17: Chapter added to
Project Book
1999-04-13: Major Revision:
round-trip phase correction (11 GHz over 1 km of fiber)
1999-08-13: Major Revision:
round-trip phase correction (25 GHz over 25 km of fiber)
Summary
The relatively new field of microwave photonics may have several applications in the MMA apart from the local oscillator generation described in 7.1. There are two further possible applications.
A round-trip phase measurement system for the local oscillator distribution.
A phase and amplitude calibration system.
Table 8.3.1 Principal milestones for photonic systems applications.
Task |
Completion Date |
|
1) |
Demonstration of round-trip correction over 1 km of fiber |
4-99 |
2) |
Demonstration of calibration system at 80-100 GHz |
6-99 |
| 3) | Demonstration of round-trip correction over 25 km of fiber | 8-99 |
8.3 Photonic Systems
8.3.1 Introduction
The possible application of microwave photonics to the MMA local oscillator system is dealt with elsewhere in this project book ( Chapter 7.1, Photonic Local Oscillator ). However, there are at least two more possible applications of this fast growing field for the MMA. The first is a system to continuously measure the delay in the propagation of the local oscillator signal by measuring the round-trip distance. The second is the calibration system by which a coherent signal is generated and transmitted into the receiver system. This system is described in the section on calibration hardware ( Chapter 3.2, Calibration: Hardware ).
8.3.2 Round Trip Optical Phase Correction
8.3.2.1 Introduction
As with any coherent interferometer, changes in phase of the local oscillator (LO) at all antennas must be measured and accounted for. In the conventional system, the high frequency LO is phase locked to a low (around 10 GHz) reference signal distributed to the array elements via optical fiber. Changes in the path length of this fiber, due to, for example, temperature changes or mechanical stress, result in apparent path length changes to the radio source. The specification for these path length changes is that they be measured to an accuracy of 17 microns. In this section, a method is outlined for measuring the lengths using a purely optical method that uses recently developed, commercially available optical components.
8.3.2.2 Principle of Method
The principal of the method is shown in Figure 8.3.1. Although the principal is shown here as applied to the laser LO system, the method is applicable to the conventional LO system also. The key recent technological advance here is the availability of highly stable, very narrow line-width lasers. For example, erbium doped fiber lasers are now available that have linewidths of less than 10 KHz and frequency stabilities of better than 10 MHZ per hour. With this coherence length and stability, it becomes possible to continuously measure the length of the fiber from the central location to the receiver to a precision of better than one wavelength at 1.5 microns.
Figure 8.3.1 Local Oscillator Generation with Round-trip Correction
8.3.2.3 Details of the Method
Refer to Figure 8.3.1, which shows the principal applied to the laser LO system previously described. The two lasers at frequencies F1 and F2 are combined after a small amount of signal is coupled from each. The phase locking circuitry described in MMA Memo #200, Photonic Local Oscillator for the MMA results in the difference frequency equaling the desired LO frequency. At the far end of the fiber, probably within the rec eiver, a portion of the optical signal is frequency shifted about 50 MHz and is returned to the central location where the frequency-shifted optical signal for each laser is mixed with the outgoing un-shifted signal. The phase of the resulting beat note for each laser frequency is then used to close a servo loop for each laser frequency with a servo system. This servo consist of two different loop one inside the other:
a piezo line stretcher thakes in account for the fastest variation (few KHz of bandwidth) in the phase of the signal. However its range is limitated to few tens of microns. To correct for greater range we use a
free space stretcher driven by a linear motor. The effective band of this device i smaller than the piezo's one (few hundreds of Hz) but the range is bigger (few millimiters).
With this servo system we have been able to correct for many hors the phase of an LO signal (11 GHz) along a fiber transmission line (1 km).
8.3.2.4 Development Goal
We have conducted preliminary experiments to determine the feasibility of the above approach. The block diagram of our experimental set up is shown in figure 8.3.2.
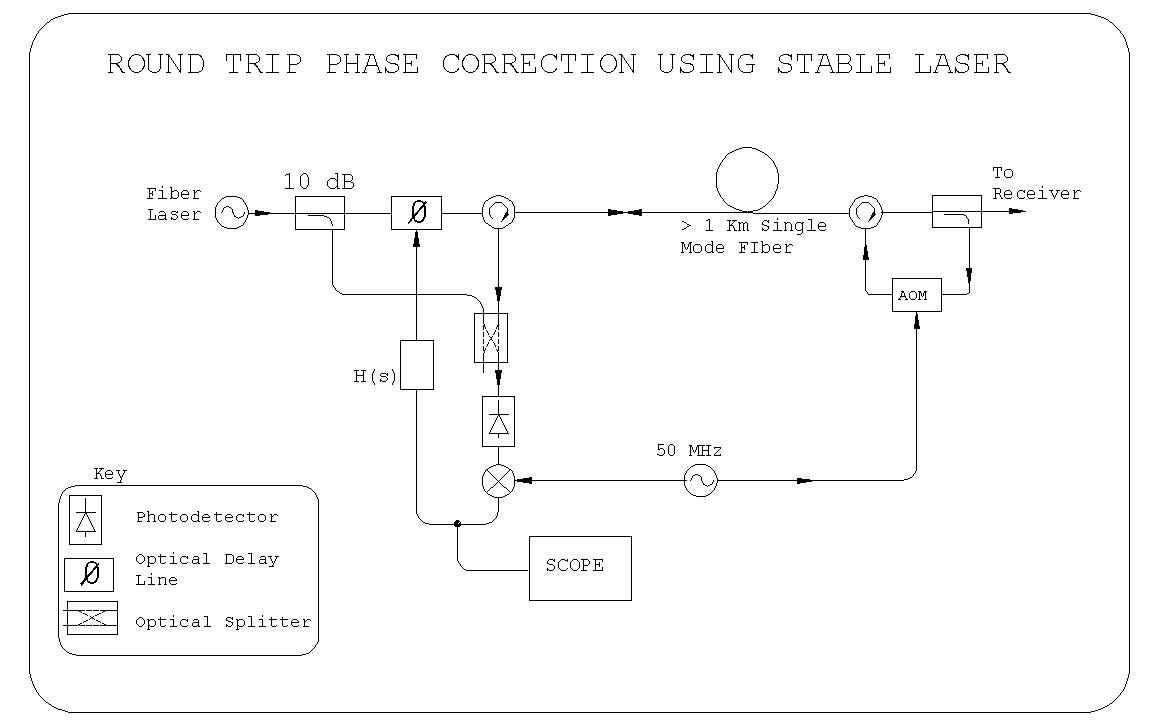
Fig. 8.3.2
The initial results from this experiment are shown in figure 8.3.3, a plot of the uncorrected path length changes in the 1 km length of fiber. This shows many turns of phase throughout the measurement period. We noticed that this was due mainly to micr ophonic effects.
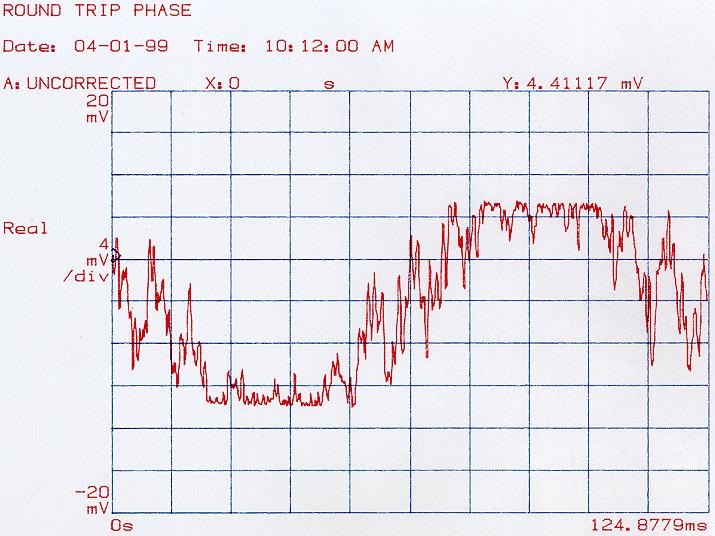
Fig. 8.3.3
Figure 8.3.4 shows the residual path length error when the servo system is closed: an RMS value of around 60 nm.
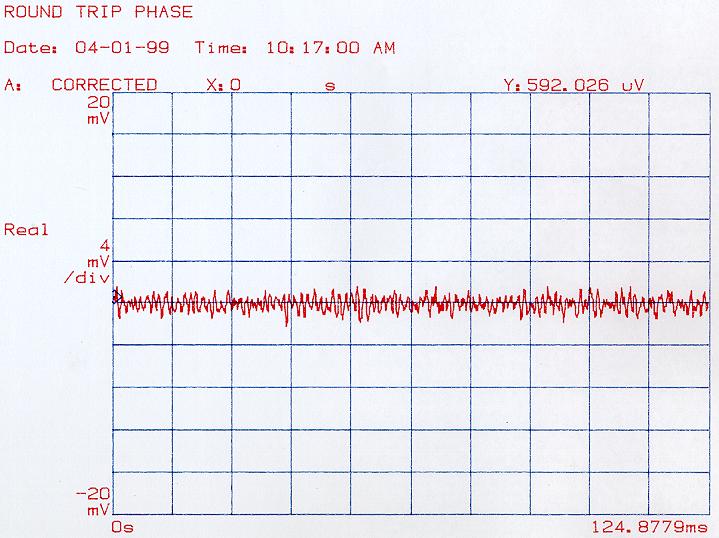
Fig. 8.3.4
In order to check the effective effect on the transmission of the LO signal along the fiber, we tested the real variation in the phase of the signal itself using a vector voltmeter. Using the scheme showed in Fig. 8.3.5, we checked the difference in phase between the LO signal (11 GHz) before and after the transmission fiber (1 km).
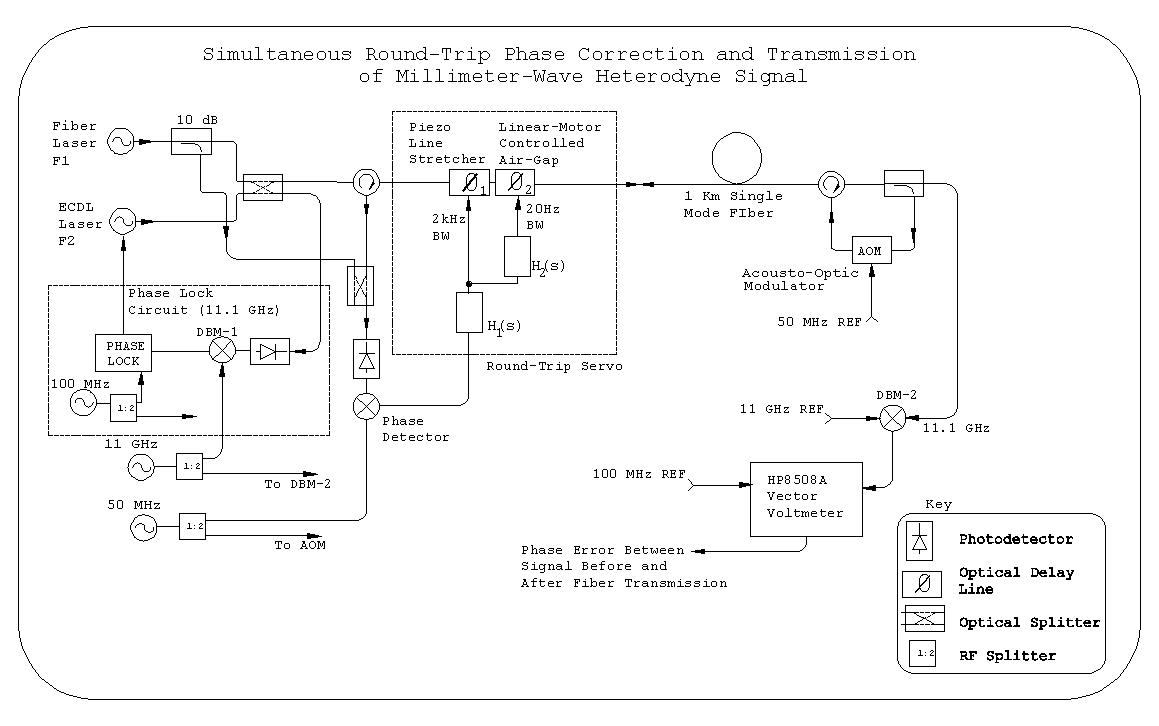
Fig. 8.3.5
We tested the correction by switching on and off the servo system an monitoring the difference in the behavior of the phase difference. As it is displayed in Fig. 8.3.6 as soon as the servo system is switched off (the blue line represent the voltage applied to the servo system) the difference (red line) in phase starts drifting. In Fig. 8.3.7 is displayed the behavior of the phase difference with the servo system on (blu line) and off (red line).
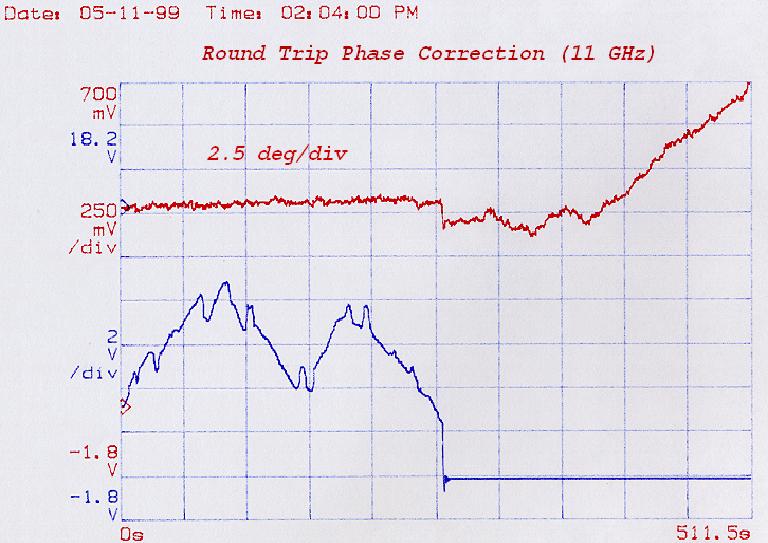
Fig 8.3.5
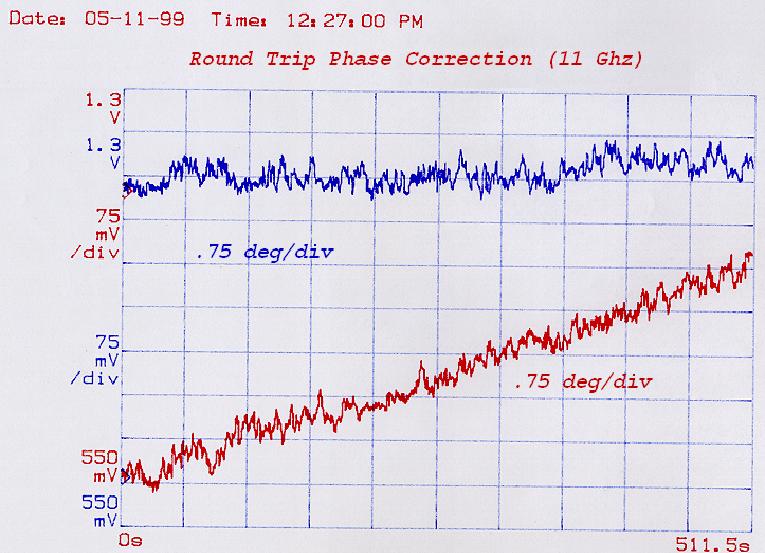
Fig. 8.3.6
We also tested the round-trip correction with a 25 GHz LO signal over 25 km of fiber. The results are shown in figures 8.3.7 and 8.3.8 where the red line is the phase difference and the blu line is the air-gap stretcher position.
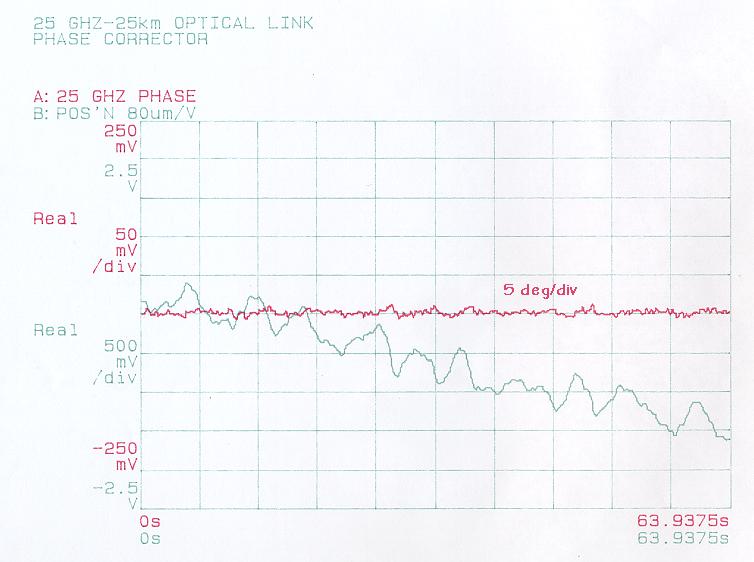
Fig. 8.3.7
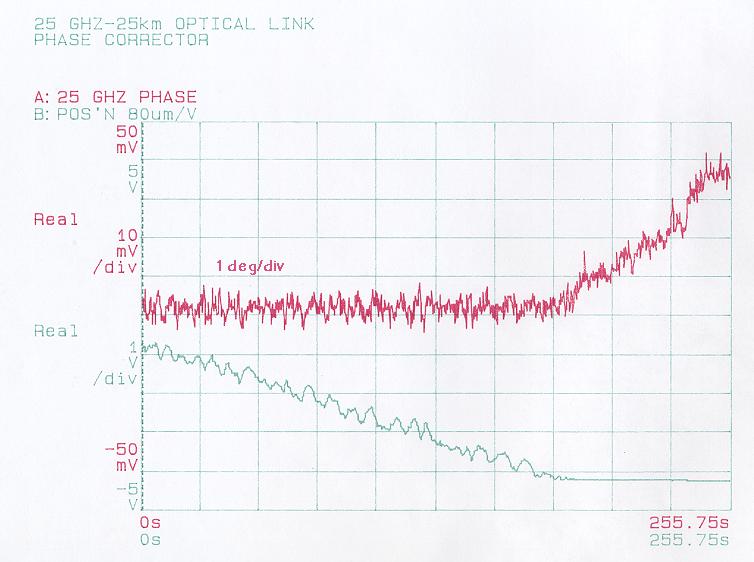
Fig 8.3.8
We will soon try the same scheme with higher LO frequency.
8.3.3 Phase and Amplitude Calibration.
This method of calibration is described more fully in Chapter 3.2, Calibration: Hardware. The method consists of radiating a coherent signal from a small bro ad-band antenna in the center of the subreflector. The signal will be generated in the manner outlined in 8.3.2 above with the round-trip measurement system incorporated.
8.3.3.1 Development Work
Combined with the development work described in 8.3.2., we hope to be able to demonstrate the transmission of a phase-stable tone at 100 GHz into a receiver by 7-99. If successful, we will focus on the design of an integrated photo-diode/ quasi-optical combination with the goal of achieving maximum frequency coverage ase described in Chapter 3.2, Calibration: Hardware.